4. Whales module
Module link: https://my.whalepro.org/wallets
4.1. Module overview
The Whales module allows you to:
- Track wallets on charts in the familiar TradingView-like interface.
- Access a database of whale wallets via a graphical interface so you can filter addresses like products in an online store and get the selection you need.
As soon as we find a wallet (a whale) whose behavior we like on the chart (for example, it tended to sell at price peaks and accumulate at bottoms), we should set up a notification that arrives on our phone (preferably in Telegram) and configure it to our needs.
4.2. Module interface
After registering on the platform, you will see the following interface in the wallets module.
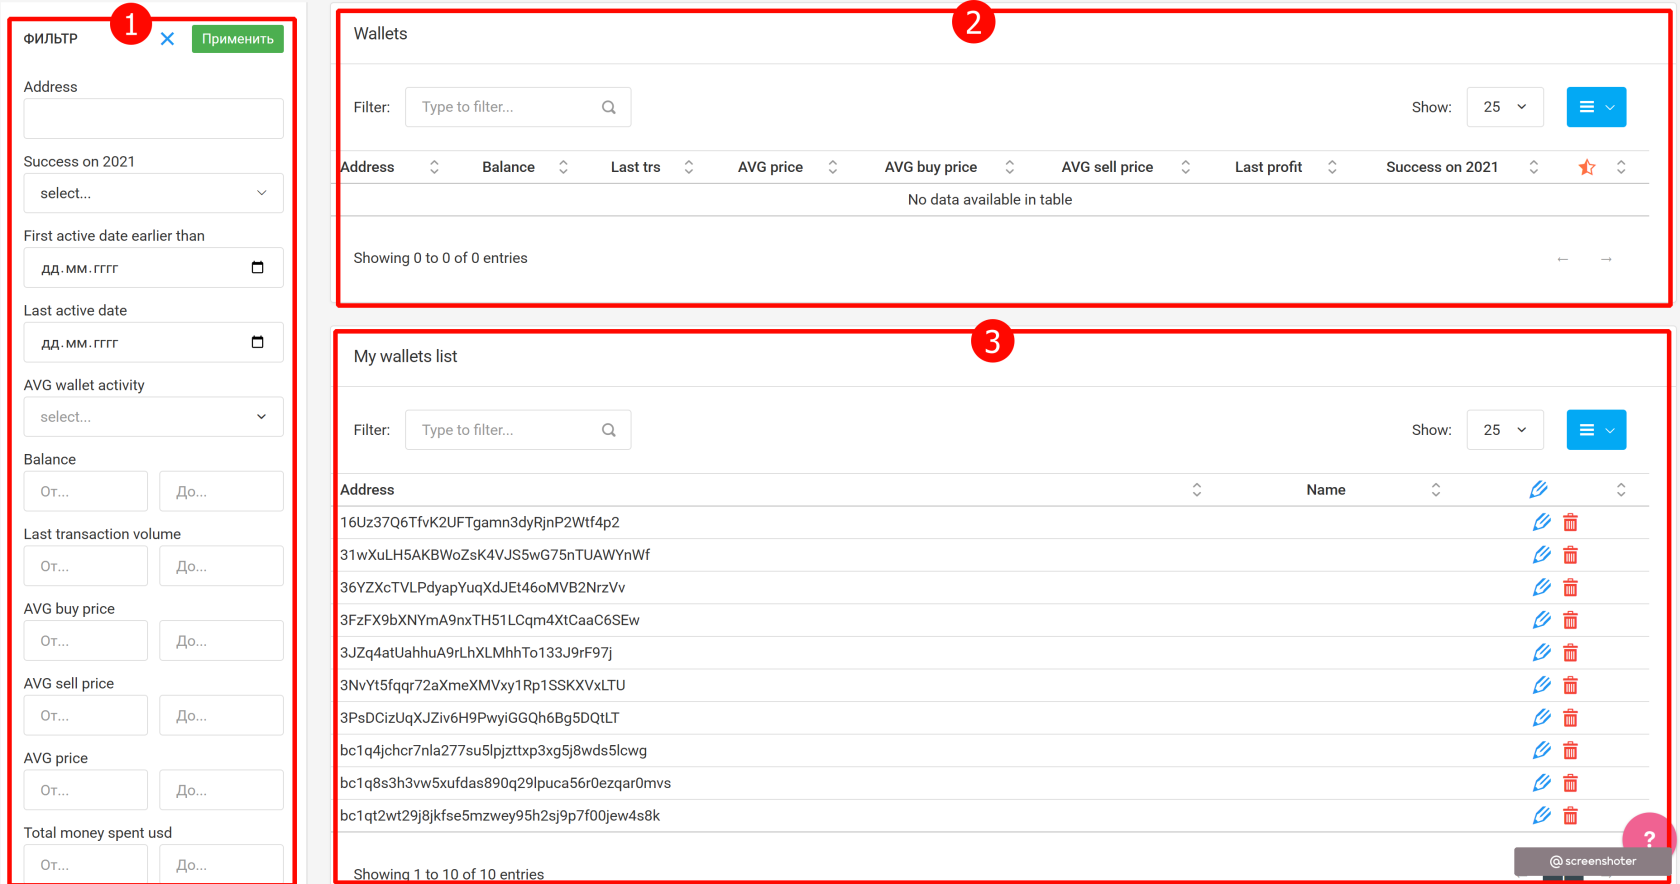
1 — filters area for selecting wallets from the database.
2 — the table of wallets found by filters.
3 — the favorites area with wallets you liked.
First, let’s look at the filter metrics for selecting wallets from the database.
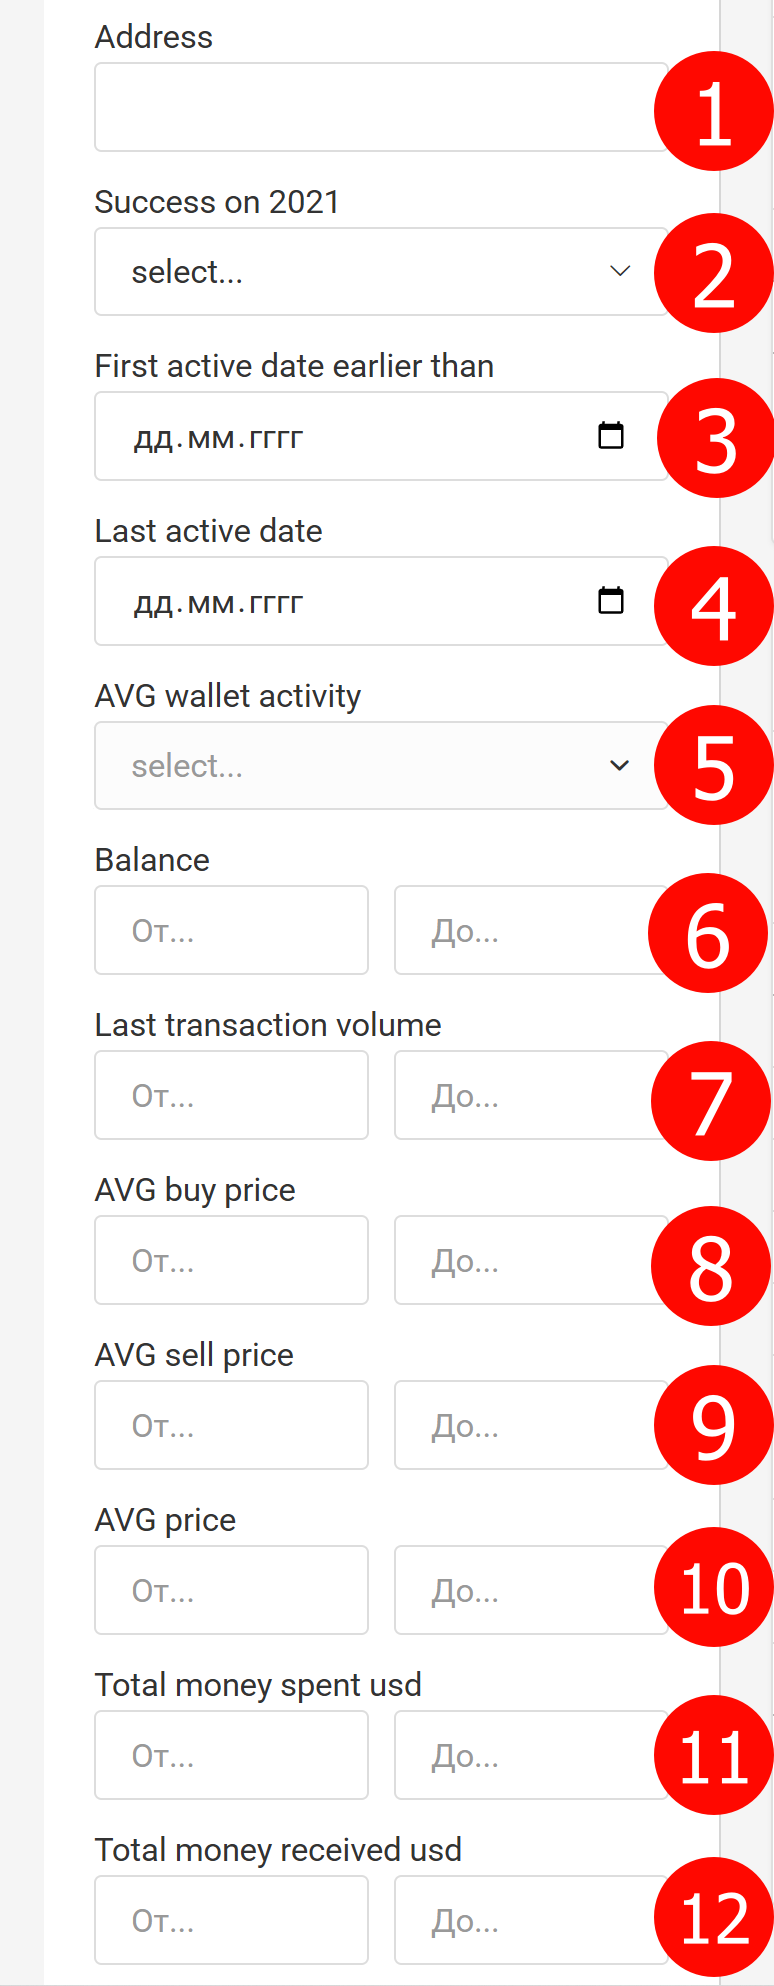
1 — Address
Paste a wallet address here if you know it.
2 — Success in 2021
A subjective success score for 2021. Use with care, as the data covers a limited period and there’s no guarantee the wallet behaved the same after 2021.
3 — First active date earlier than
Set a date before which the wallet must have been active.
4 — Last active date
Set the date when the wallet was last active.
5 — AVG wallet activity
Select the average activity of the wallet. Supported values:
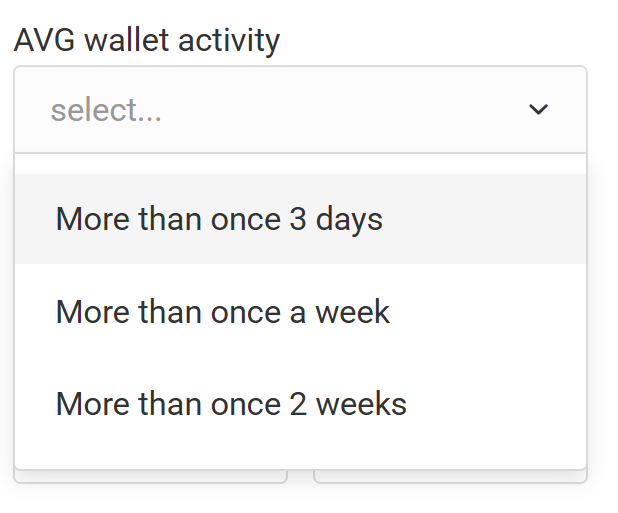
More than once per 3 days — on average more than once every 3 days over the full history.
More than once a week — on average more than once a week over the full history.
More than twice a week — on average more than two times per week over the full history.
6 — Balance
Specify the current wallet balance (value range).
7 — Last transaction volume
Specify the volume of the last documented transaction in the database.
8 — AVG buy price
The average price at which the wallet bought BTC (more precisely, the average BTCUSDT rate at the times when BTC arrived to the wallet).
9 — AVG sell price
The average price at which the wallet sold BTC (the average BTCUSDT rate at the times when BTC left the wallet).
10 — AVG price
The current average price of the wallet’s assets.
11 — Total money spent USD
Total amount of USD presumably spent to buy BTC.
12 — Total money received USD
Total amount of USD presumably received from selling BTC.
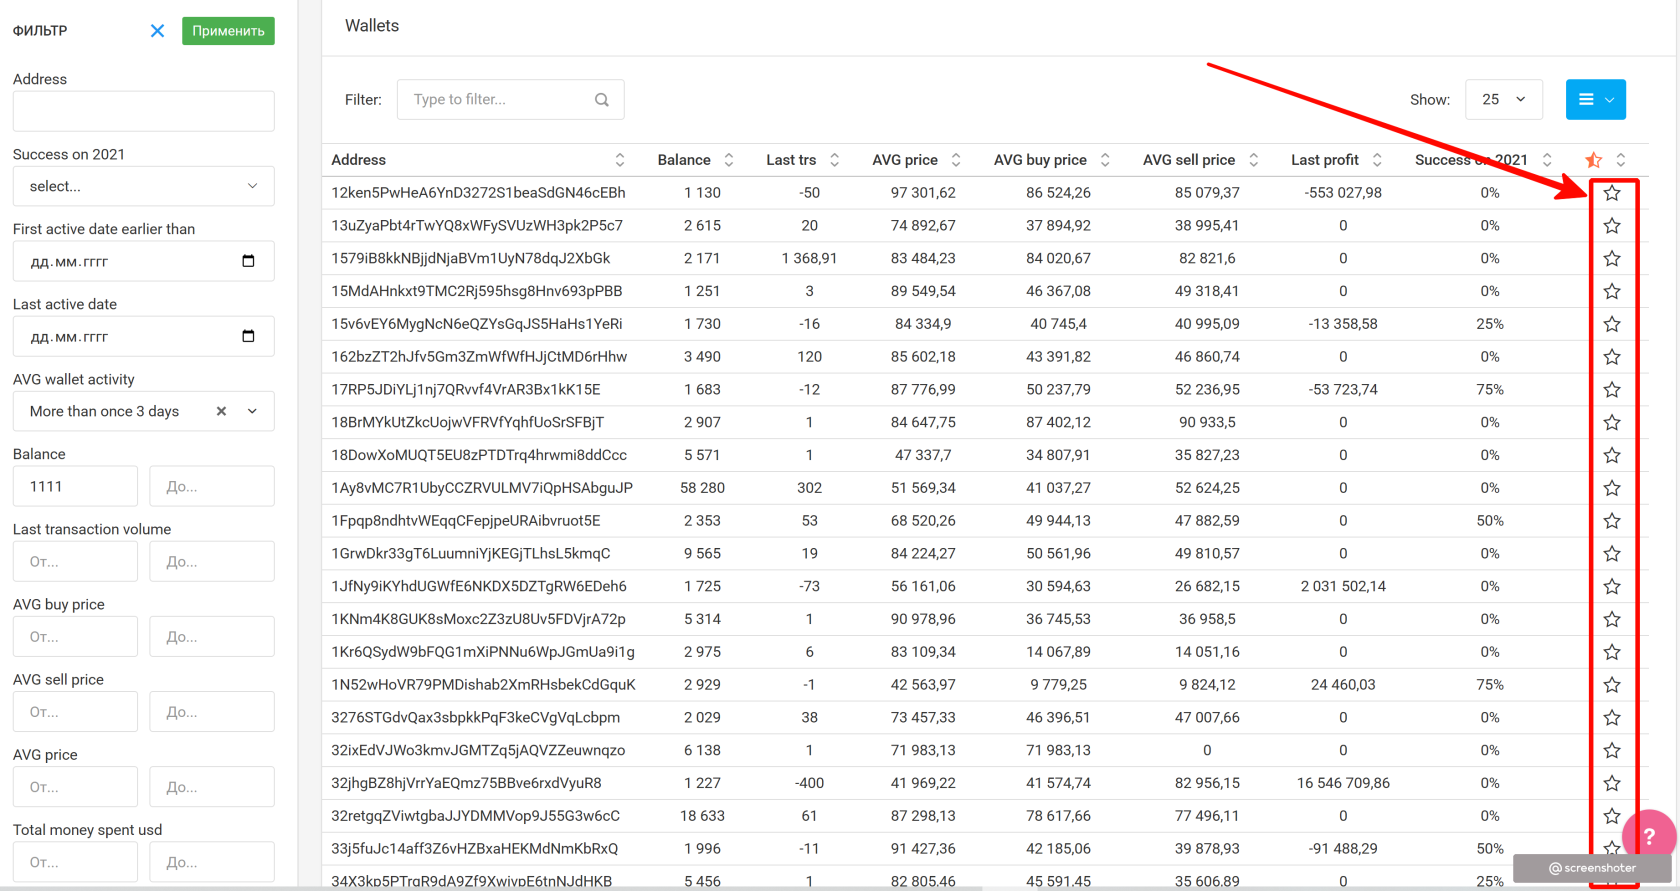
4.3. How to use
The workflow is straightforward: filter data on the left (1) and get a list of specific wallets on the right (2). Then add the interesting wallets to Favorites.
In 2025 we added a quick preview of how a wallet behaved over the last year on the 1d timeframe.
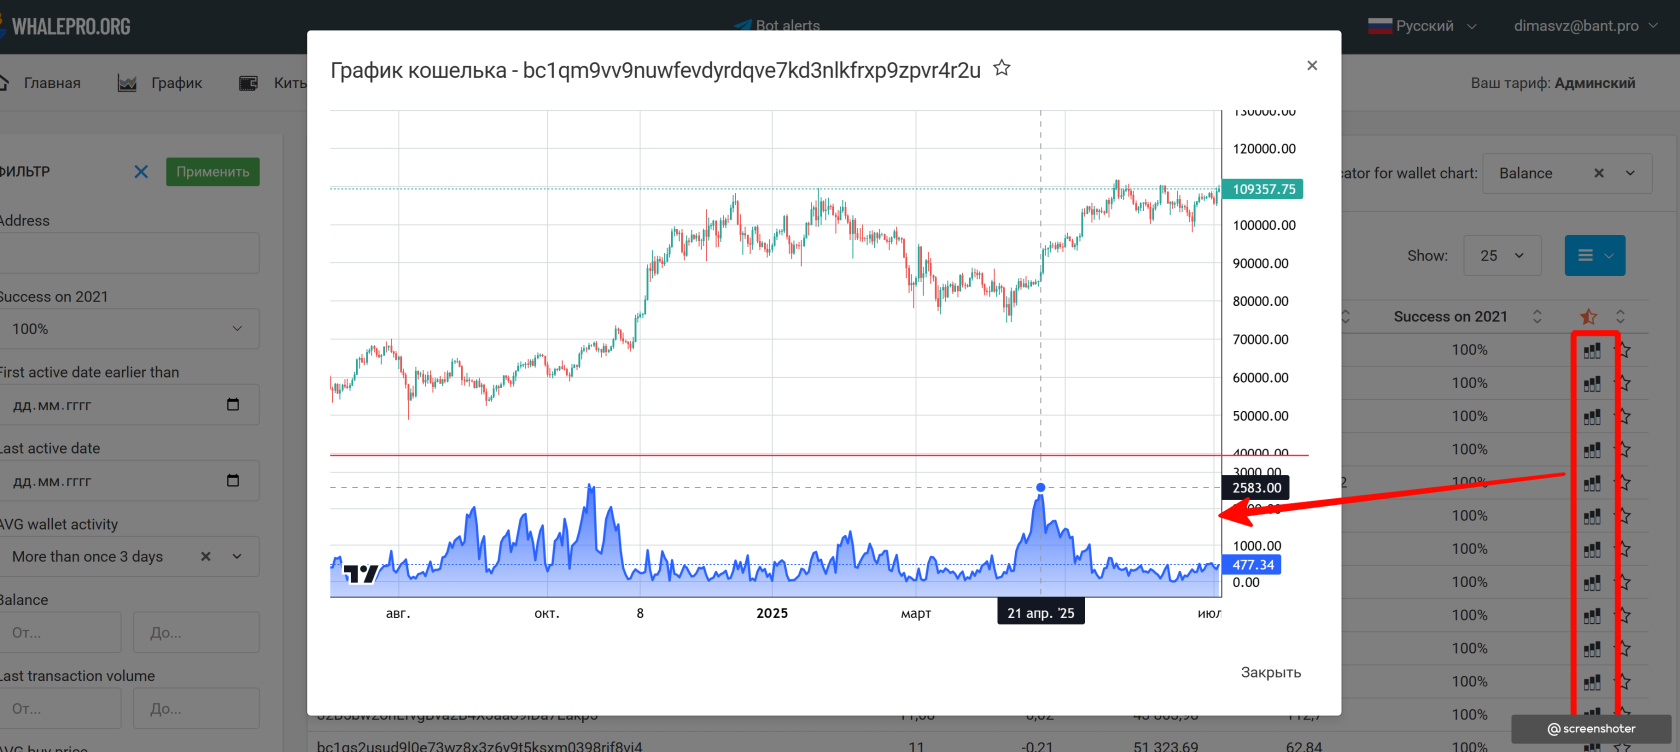
If you like what you see, i.e., you spot some patterns, you can add that wallet to Favorites.
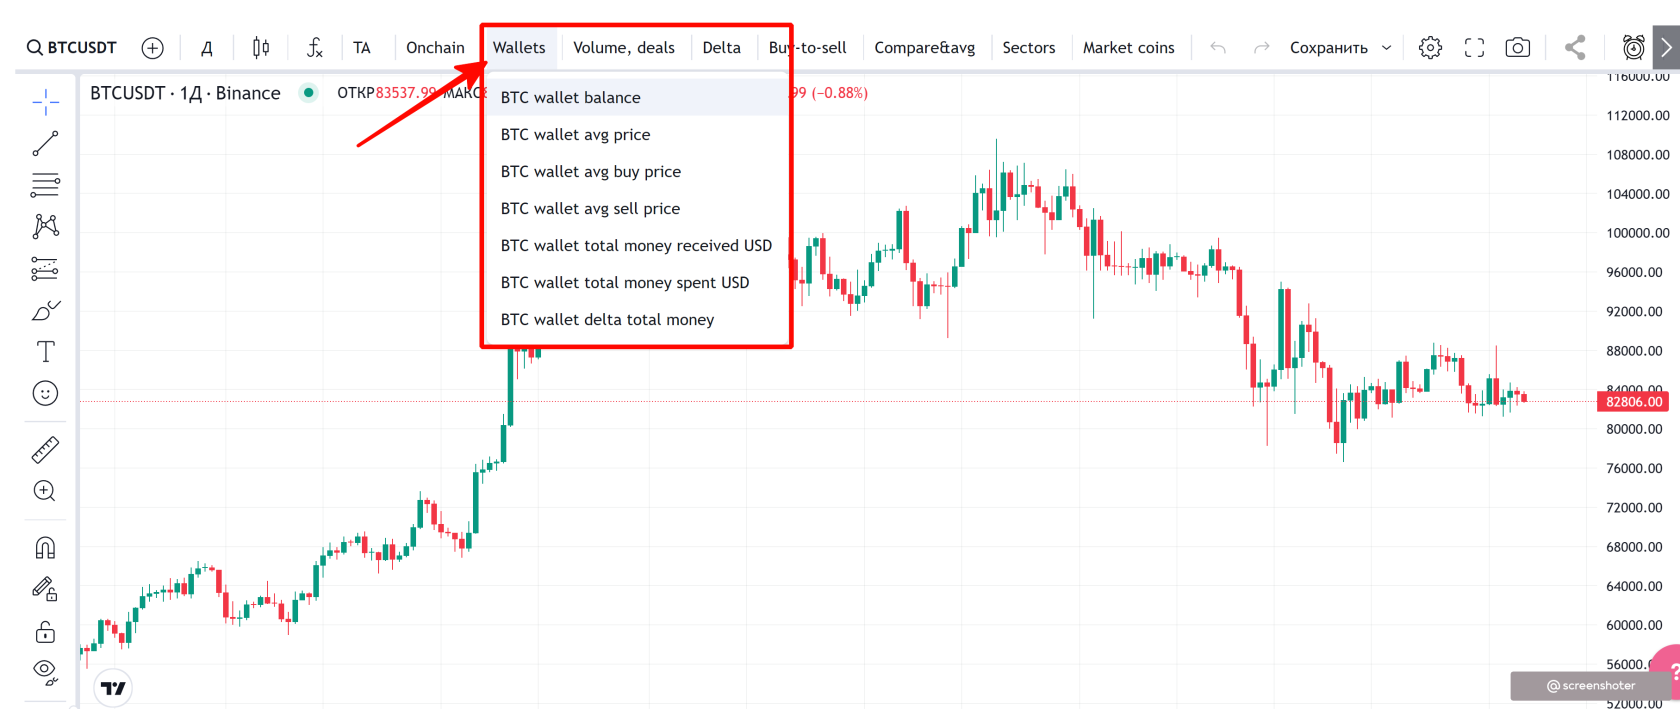
After that, go to the chart module and open the wallet indicator there, for example, BTC wallet balance:
Open the indicator settings and you will see the wallets you added to Favorites.
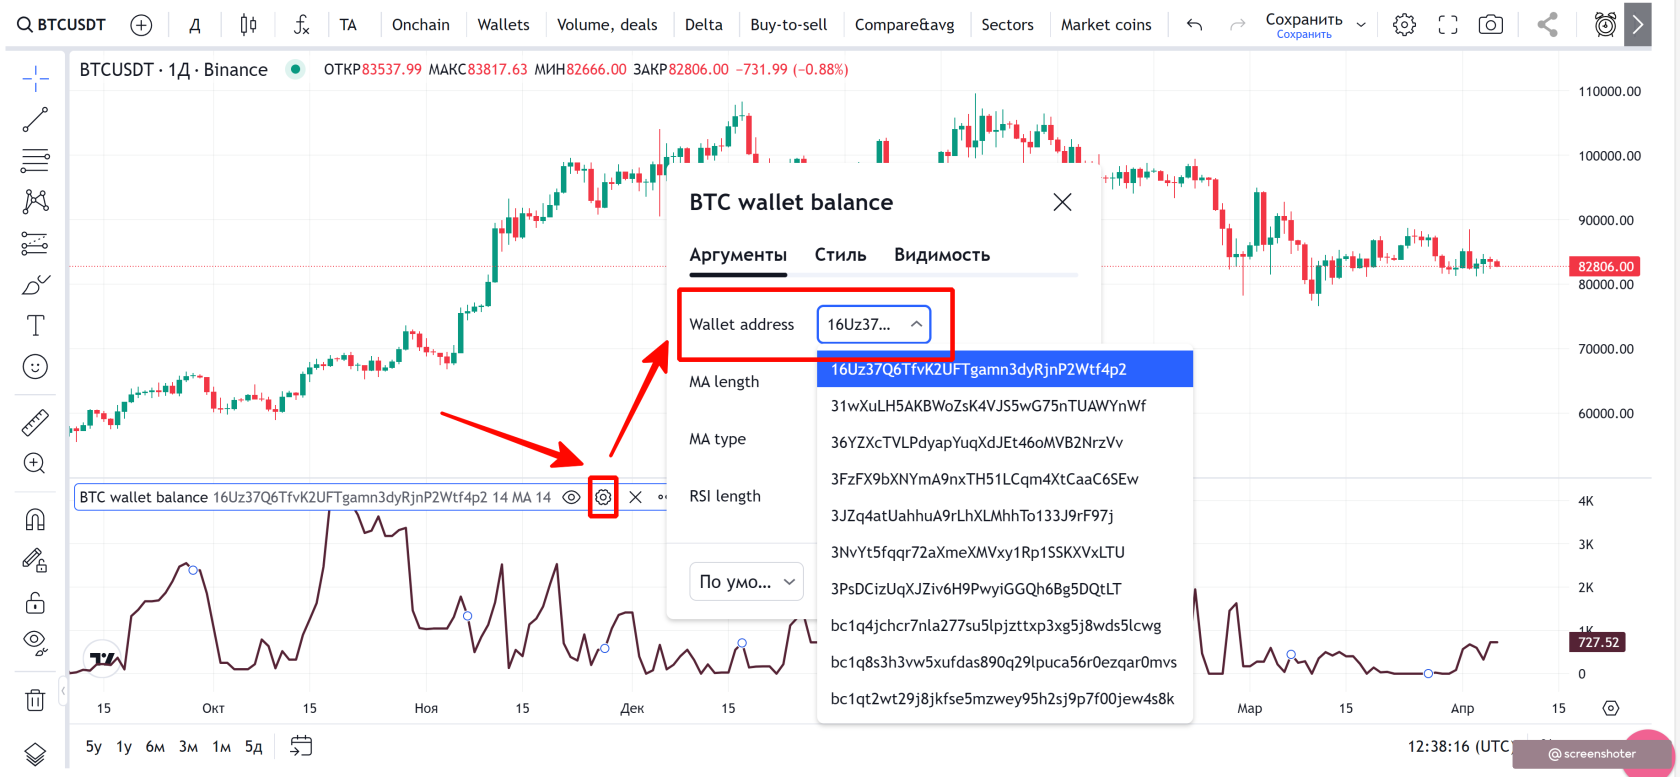
Select the desired wallet and view it on a familiar, convenient chart with all TradingView features.
How to set up notifications about wallet actions
Let’s say you found a wallet you want to follow. Now set up notifications for its actions. For simplicity, we’ll show alerts on the wallet balance change metric. As a concrete example, let’s take wallet 3JZq4atUahhuA9rLhXLMhhTo133J9rF97j on the 4h timeframe.
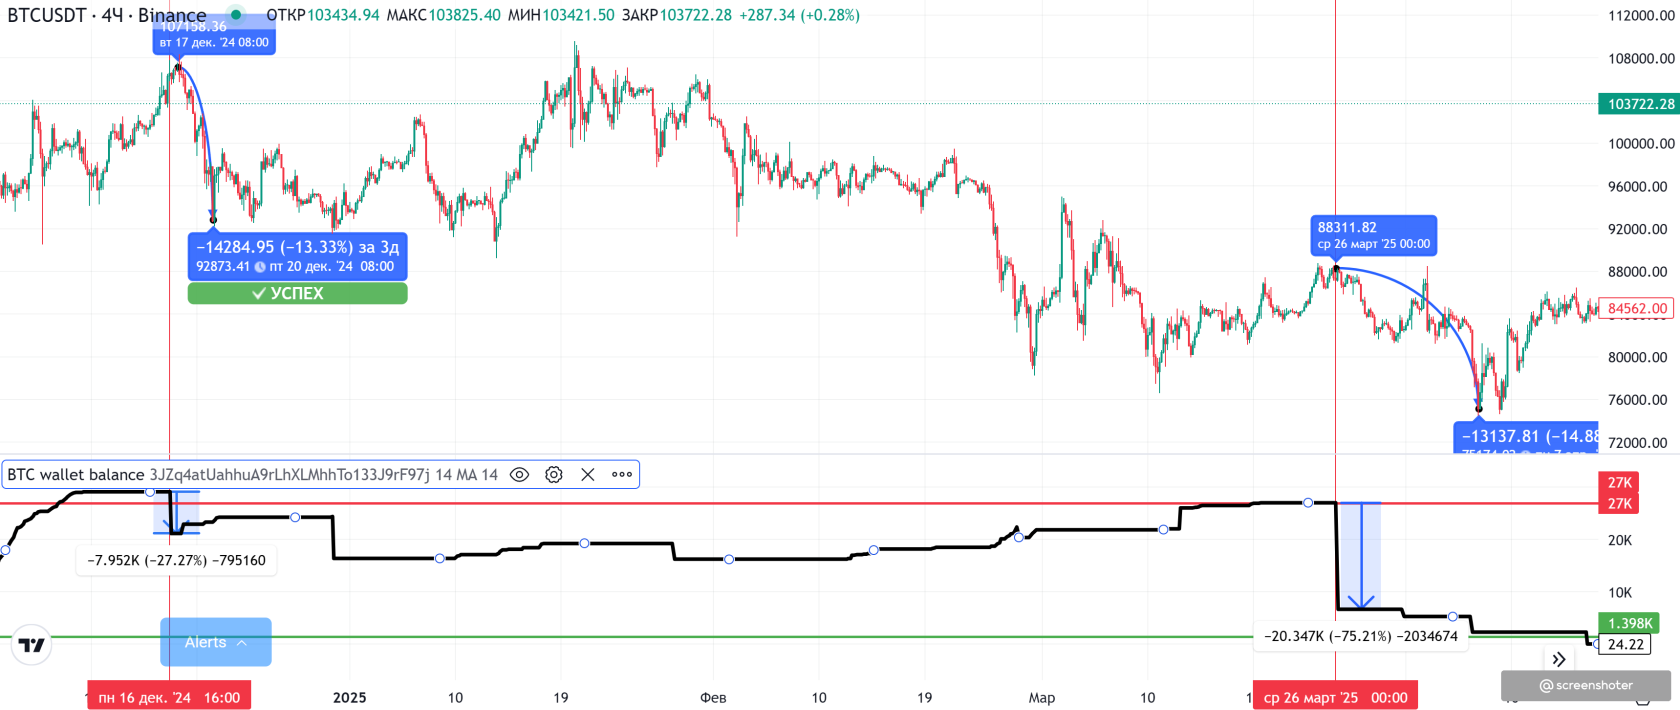
The chart shows this wallet usually holds about 27,000 BTC, which is often its local maximum. Note that when it sharply “drops” the balance from this number by 27% or more, we can interpret it as the whale’s opinion of an upcoming correction of about 13–14%.
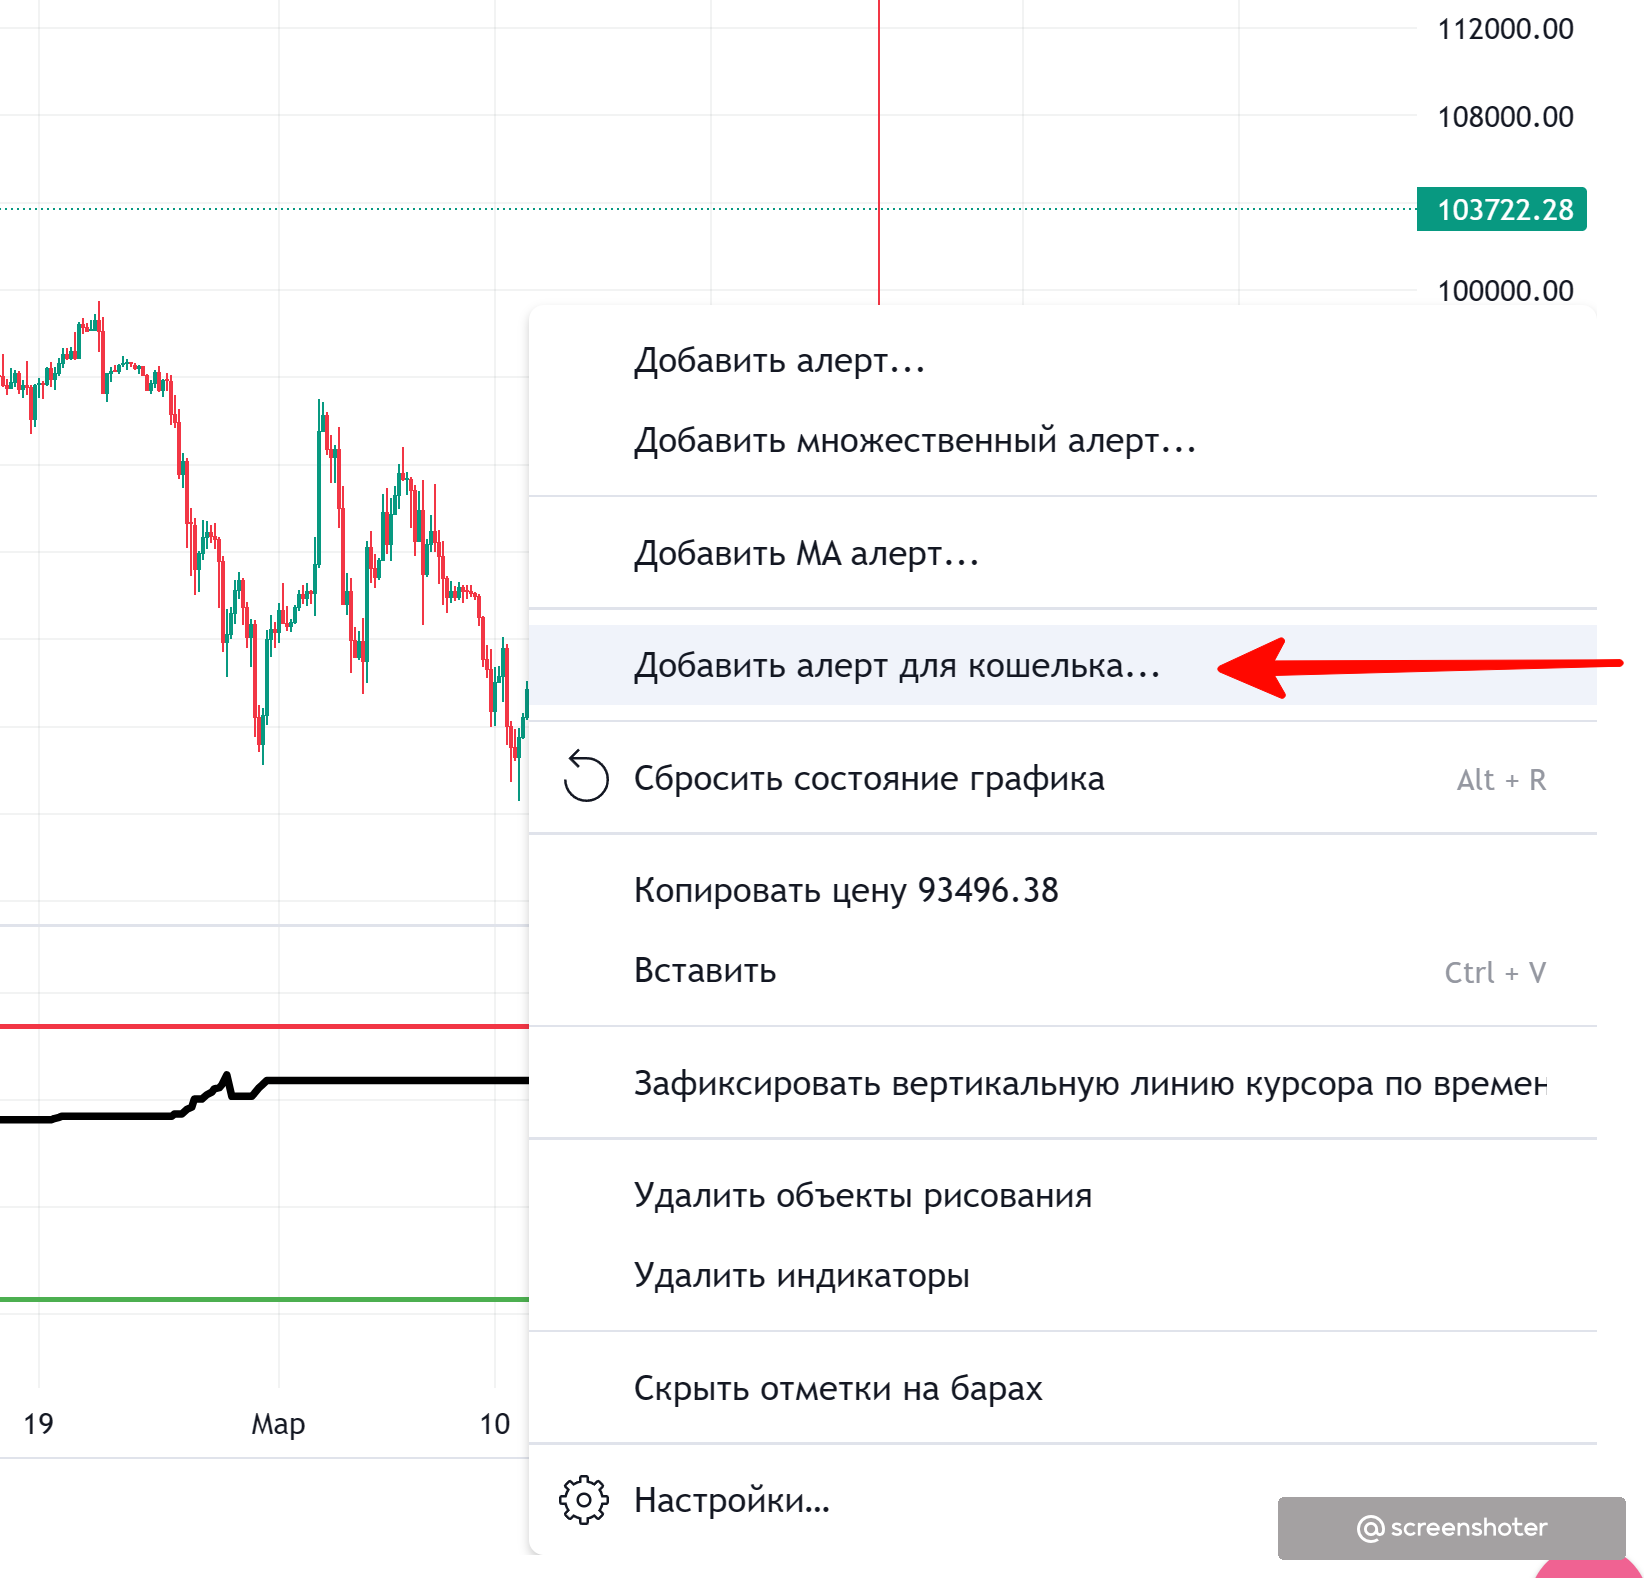
How do we set such a notification?
1) Right-click anywhere in the free space on the chart and select “Add alert for wallet”.
2) In the dialog, choose the following settings:
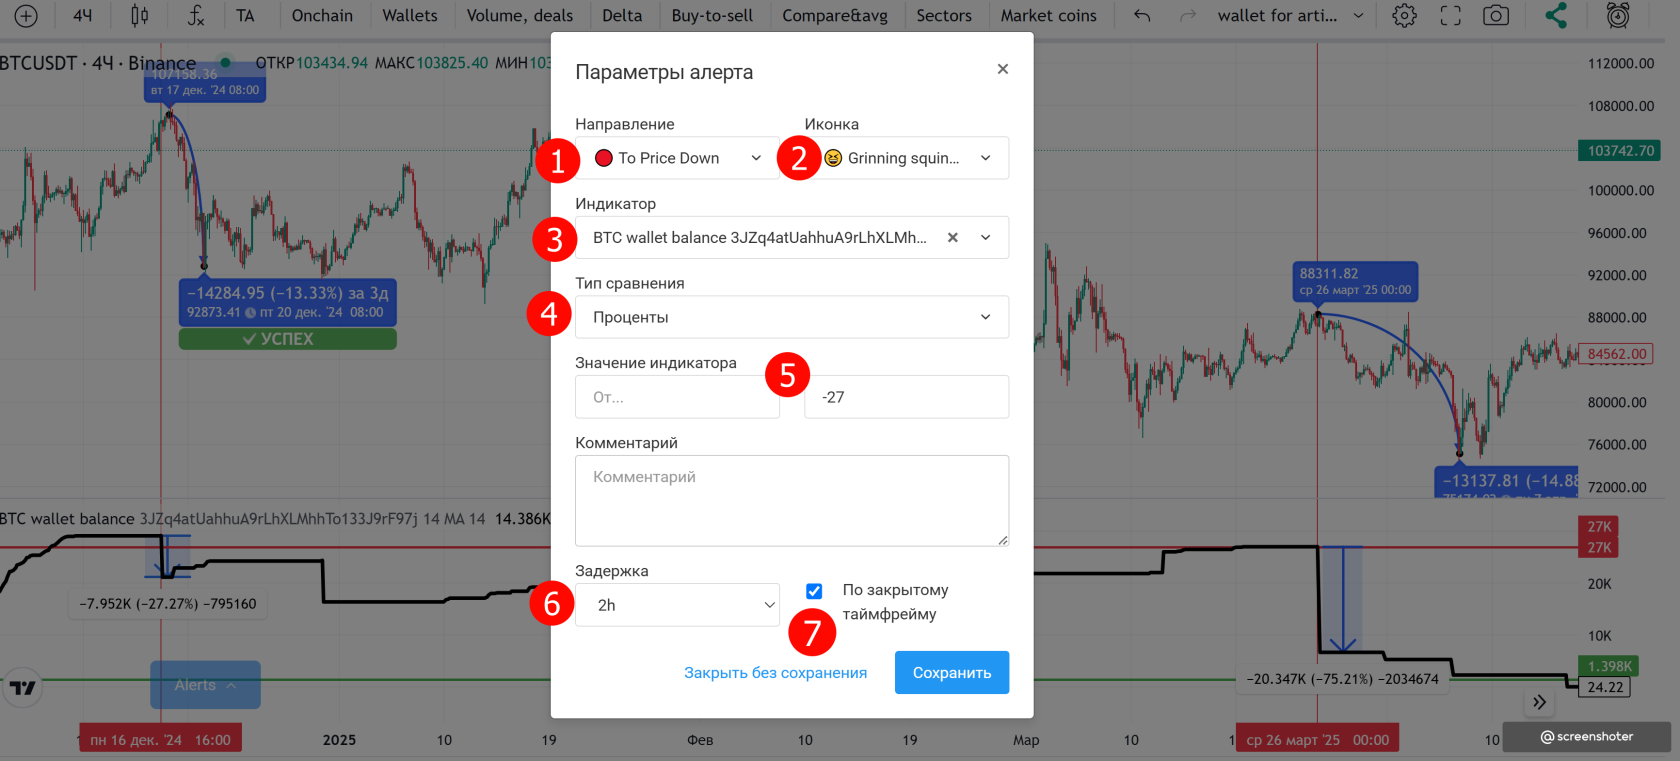
1 — Direction
To Price Down means we expect the price to go down as a result of this alert (the second value, To Price Up, is the opposite).
2 — Icon
Choose any you like. It’s only for visual styling (useful when you have a couple hundred alerts and need visual differentiation).
3 — Indicator
In this case, there’s just one option: the balance of the wallet currently displayed on the chart.
4 — Comparison type
Select Percent. If you leave the “From” field empty and put a negative value in “To” (e.g., -27), it means we look for wallet balance changes less than -27%. In other words, the setting is interpreted as (-∞; -27%).
You can also set the comparison type to Absolute numbers. In that case you could enter exact balance levels you are tracking.
5 — Comment
You can leave it blank. We recommend adding a short note, e.g., that we’re watching for significant reactions from around the 27,000 BTC level.
6 — Delay
“2 hours” means that during the processing period on the 4h timeframe you will receive at most 2 alerts. If you set “4 hours”, then on the 4h timeframe you will receive just one alert.
7 — On closed timeframe
We recommend keeping this enabled, otherwise the script will work on the current, still-open timeframe. That can cause frequent data changes and noisy alerts.
After configuring your alert, make sure you are subscribed to our Telegram bot https://t.me/bantpro_anomaly_bot, which delivers the final message.